To continue what we’ve talked and written about recently, we’re going to look at the statistics for book banning and challenging.
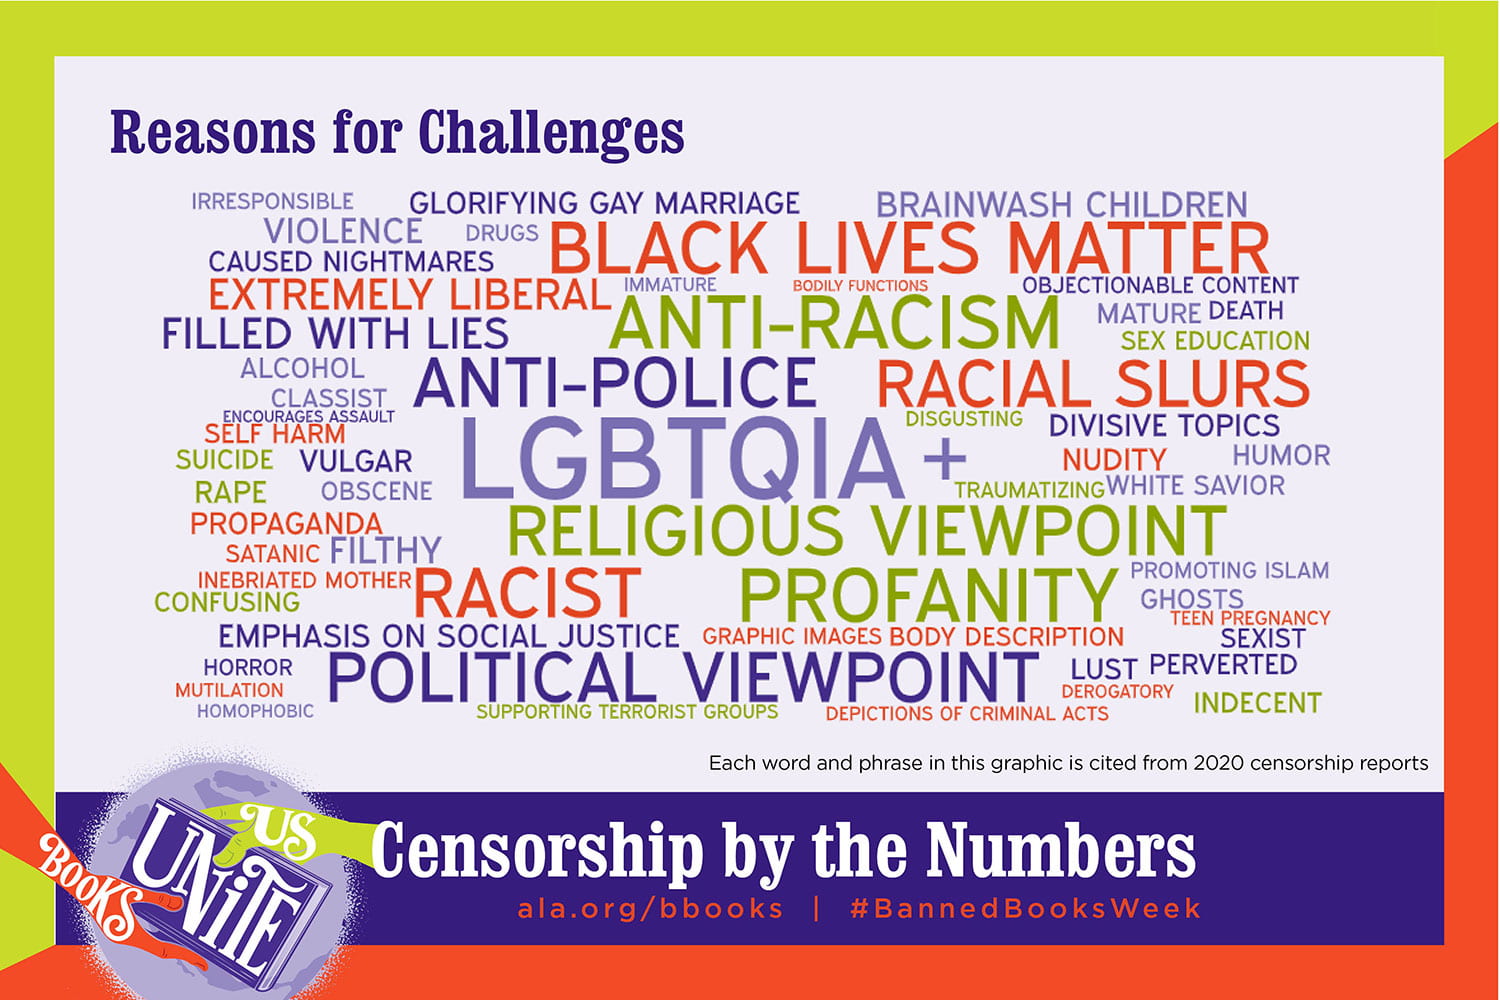
According to the American Library Association (ALA), a challenge is an attempt to remove or restrict materials, based upon the objections of a person or group. A banning is the removal of those materials. Challenges do not simply involve a person expressing a point of view; rather, they are an attempt to remove material from the curriculum or library, thereby restricting the access of others.
Here are some infographics, links, and lists I’d like you to read through:
2023:

2022:

2021:

2020: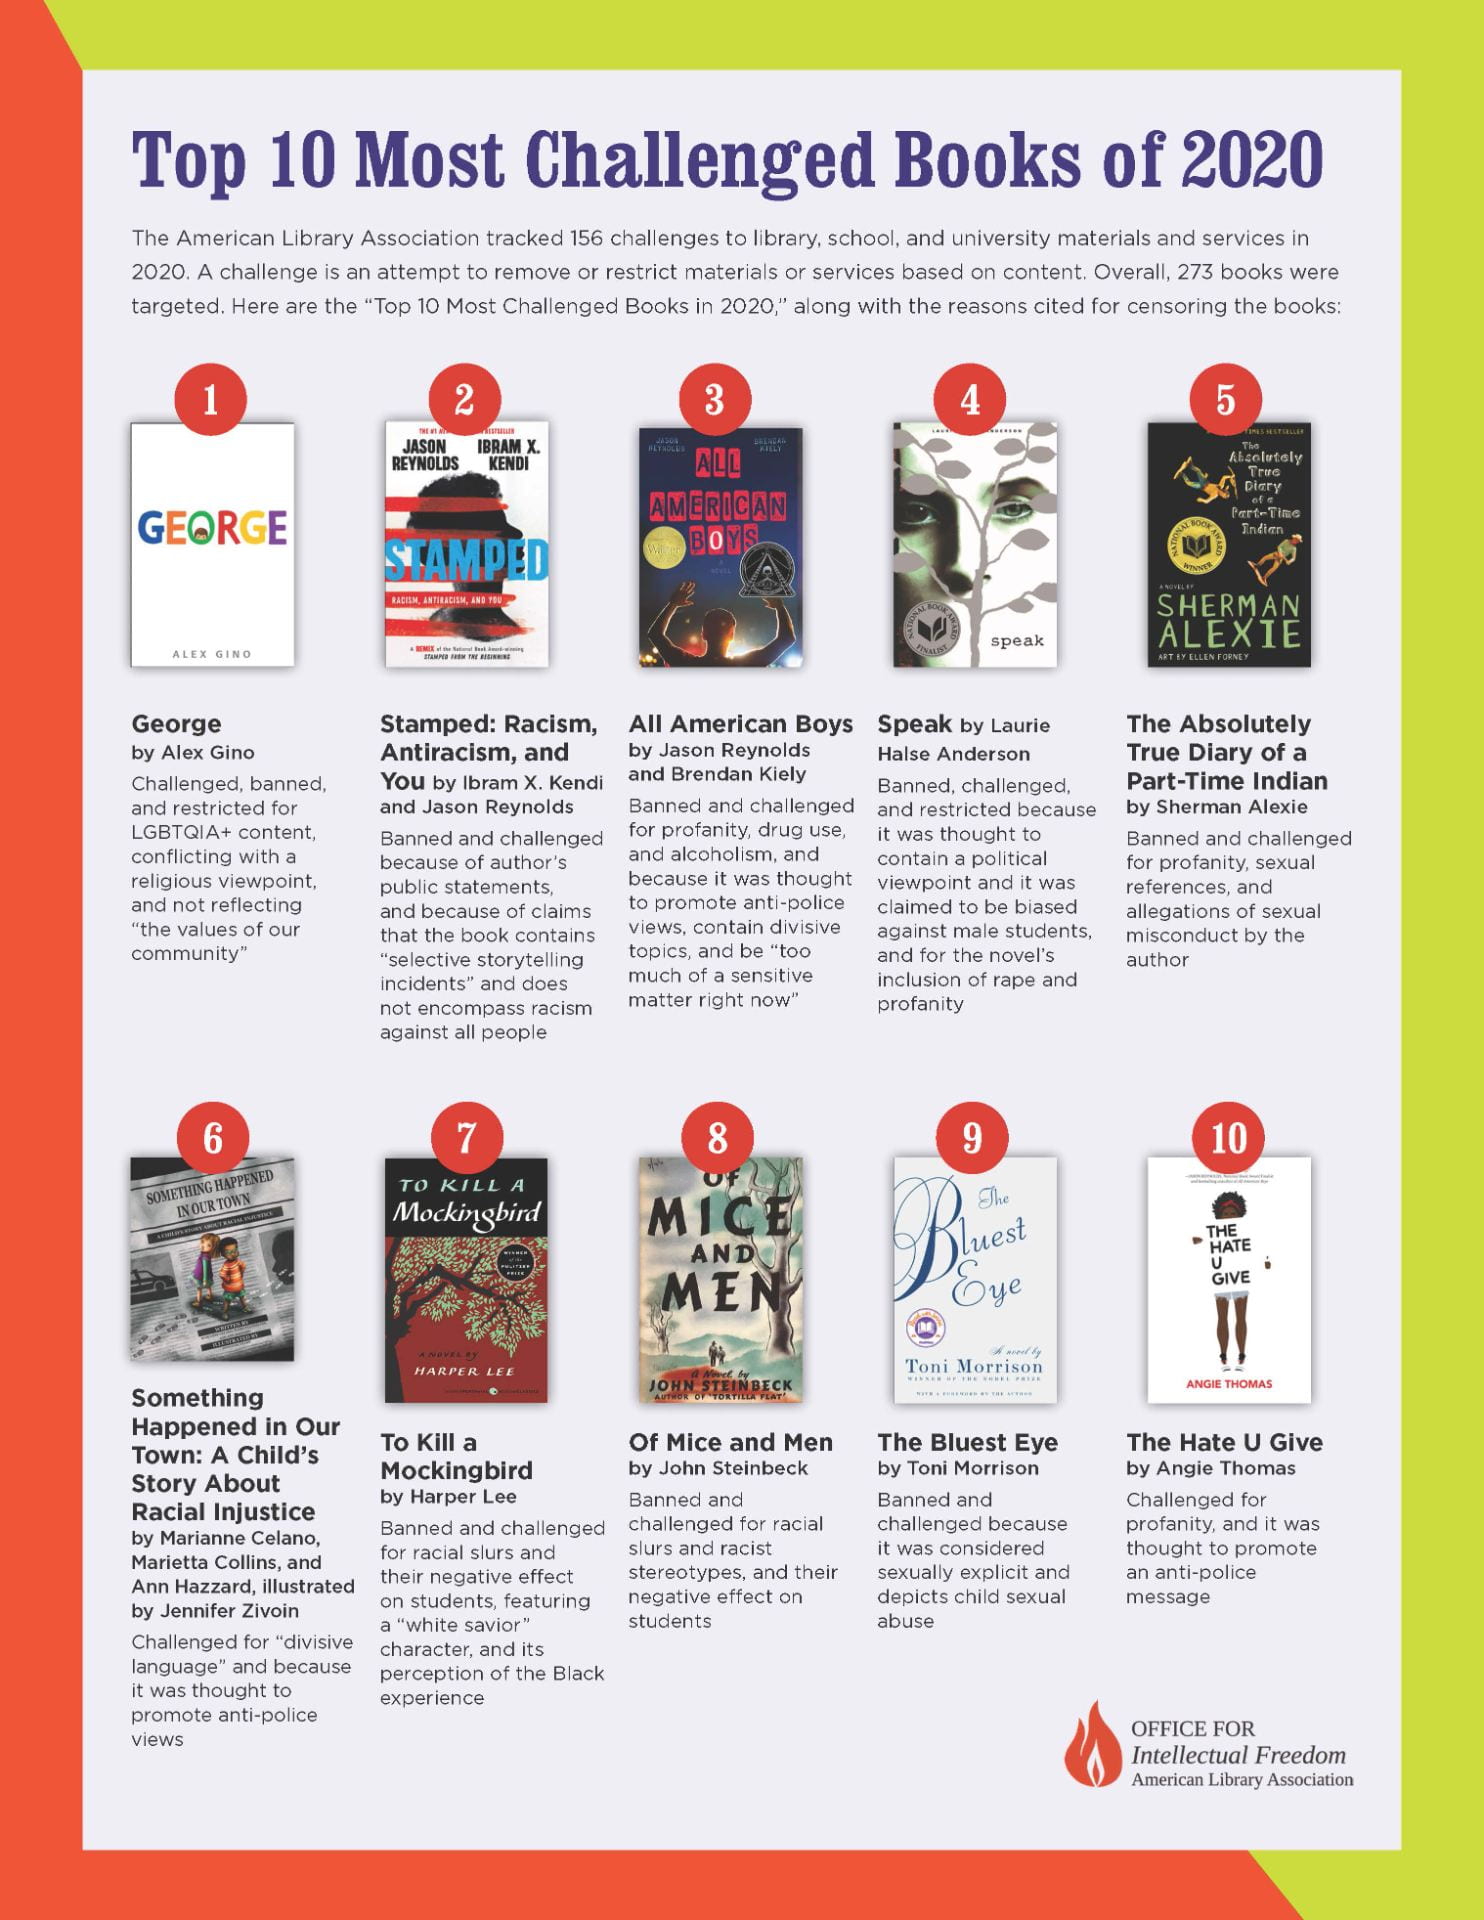
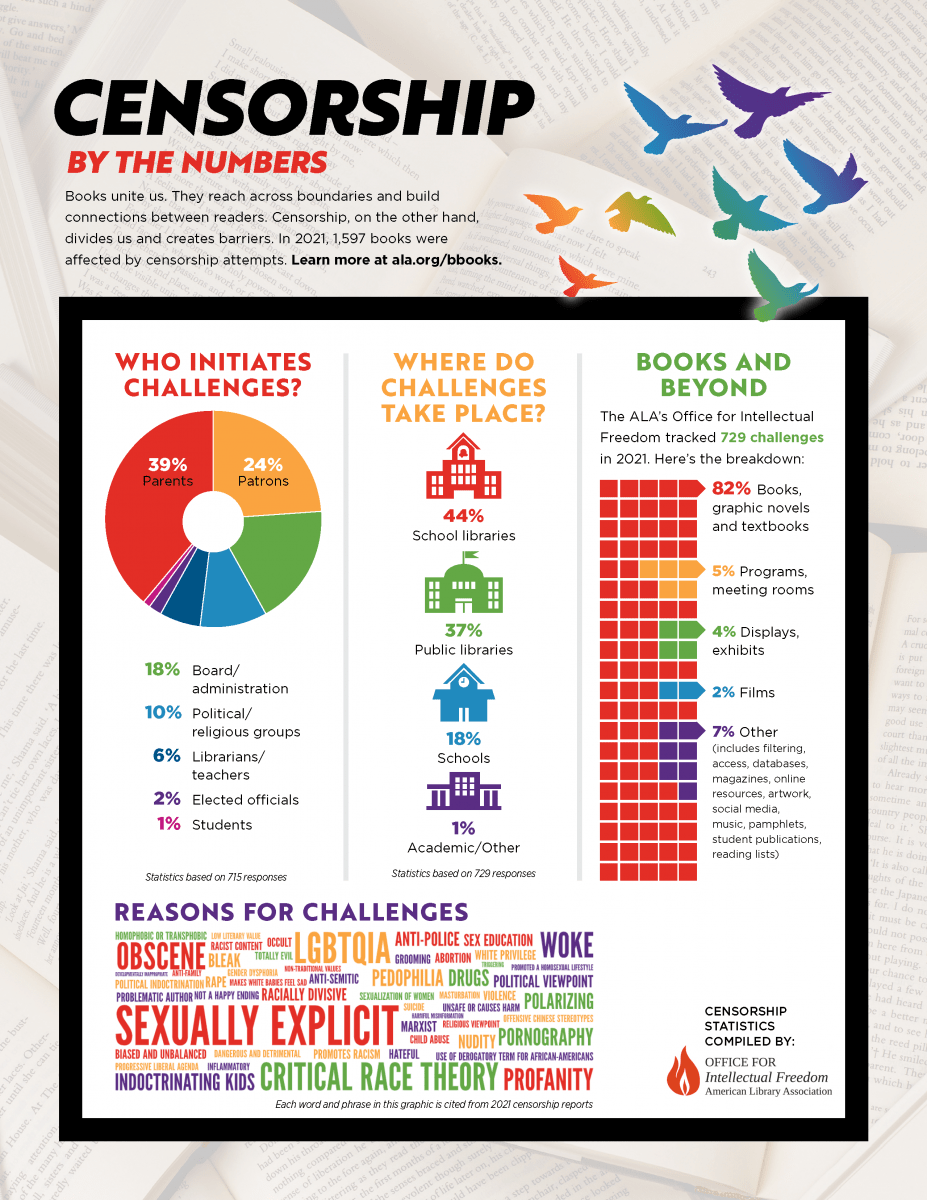
2021 Data
Finally, I’d like you to take a look at these infographics and charts:
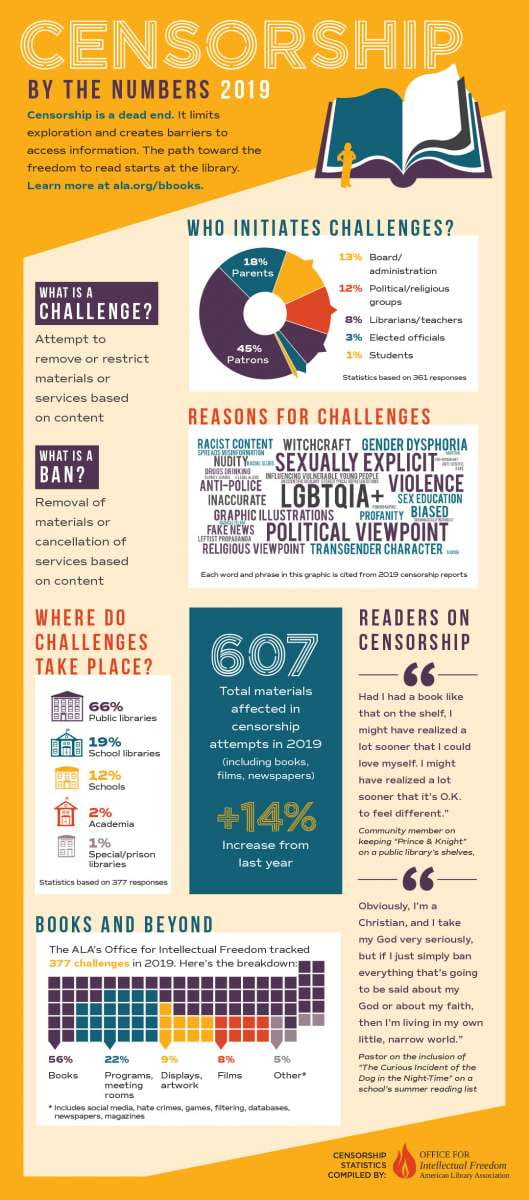
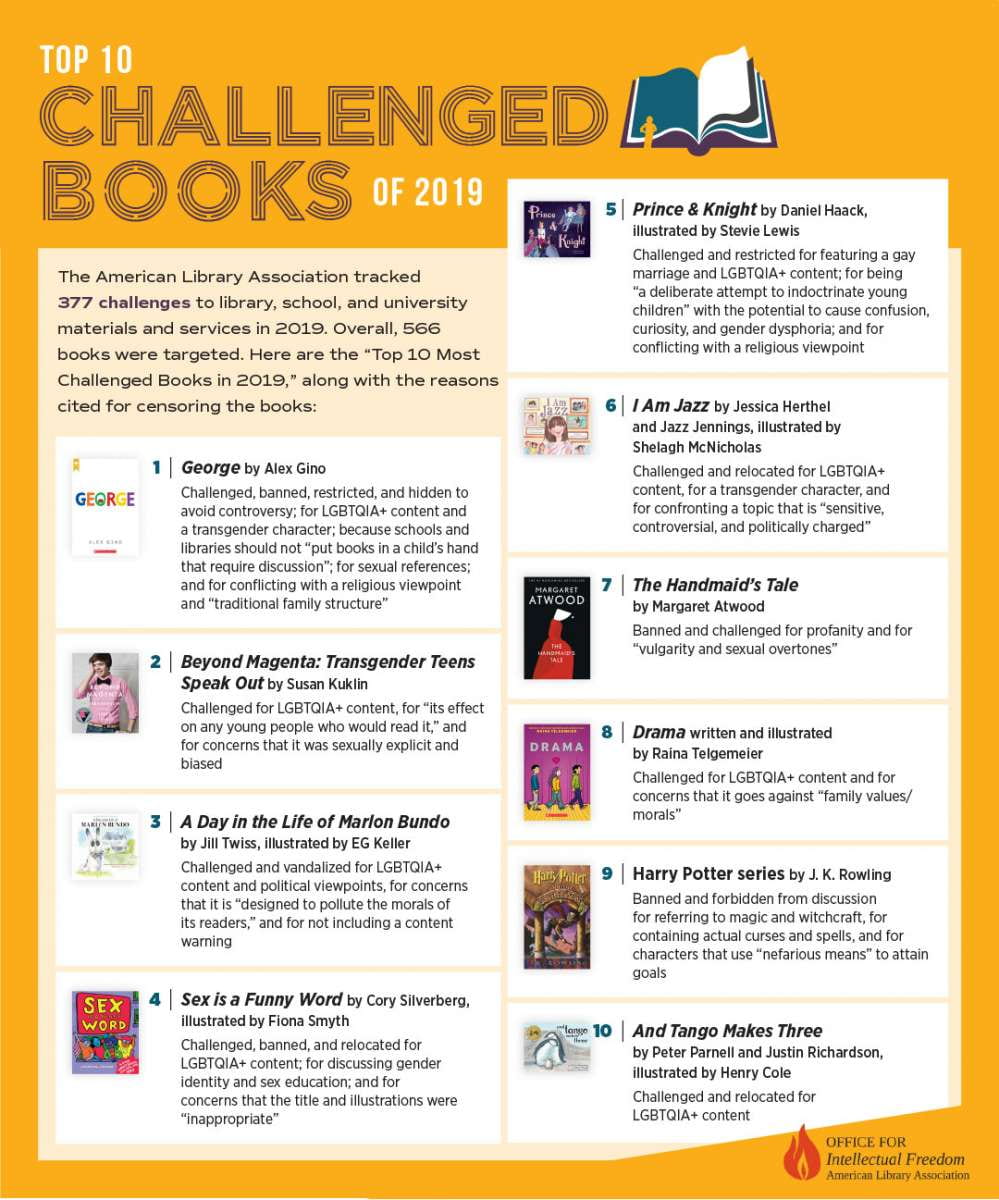
2019 info
This is the 2020 data

2021 info

2021 info
2020 info

2021 info
2022 data
2022
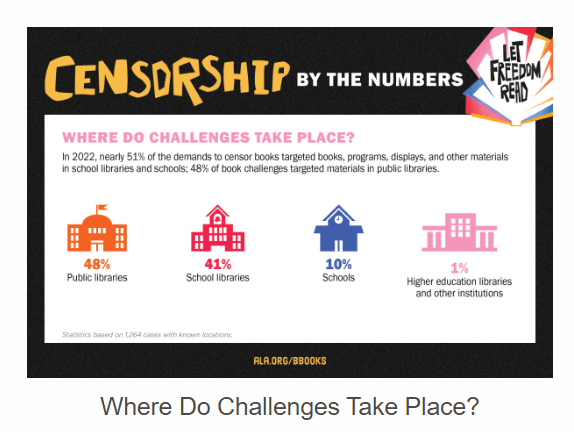
2022
You can look at these links for 2016-2018, but don’t have to.
YOU MUST LOOK AT AT LEAST ONE OF THESE THREE LINKS AND JOT A FEW NOTES DOWN
Most Frequently Challenged Authors of the 21st Century
Timeline of banned and challenged books for the last 30 years.
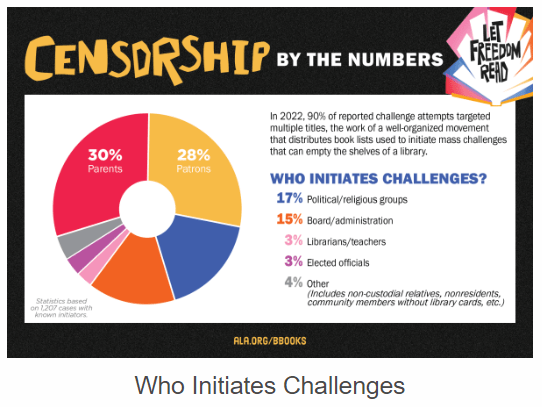
As a comment to this post, make three inferences from the different infographics and charts you’ve been given. Remember, an inference is something that you can claim/state based on the evidence you are looking at. Make sure to explain where your inference comes from (what piece of data/information).
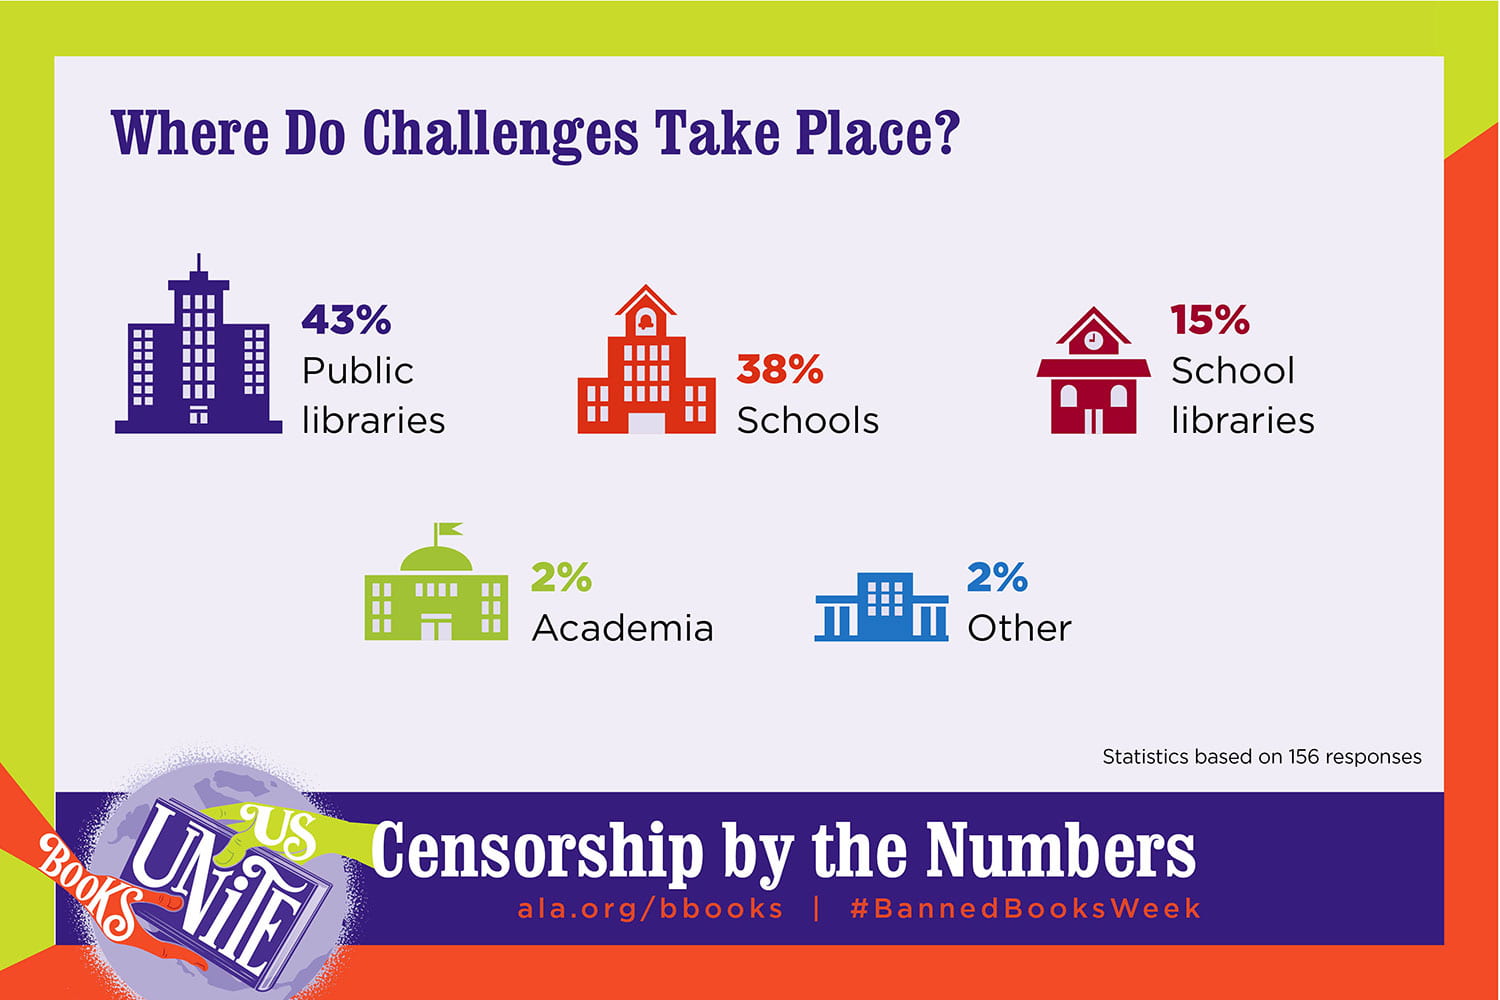
Ex: Based on the challenges by institution graph, people are mostly concerned with books when they are easily accessible for children. The largest numbers of challenges between 1990 and 2009 were in schools/libraries.
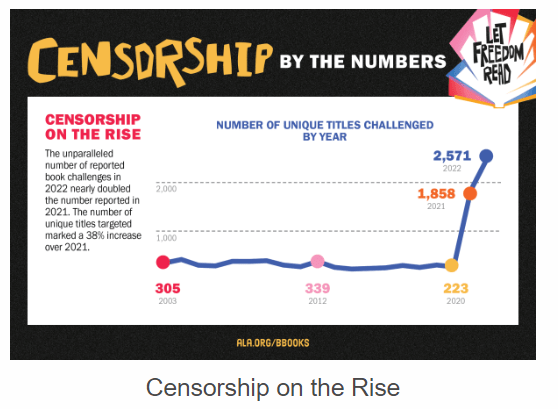
**A great way to start could be to compare the data from different years to see what can be inferred based on changes.
During class on Thursday we will read through this and post our inferences. We will then discuss all of our thoughts as a whole group to prepare us for our ACT Writing Practice.